So far July is continues the scorching hot trend our summer has seen this year, not only in Colorado but all across the U.S. A large ridge of high pressure has dominated our weather for nearly the last 2 weeks, bringing hot air into Colorado and the middle of the country from the desert Southwest.

850mb (surface) temperatures and wind profiles
This weather feature is also helping to bake the rest of the U.S. with incredibly hot temperatures and tons of humidity. Luckily we don't have to deal with the humidity too much in Colorado due to our altitude and climate, but the higher dewpoints out East are making for a miserable week.
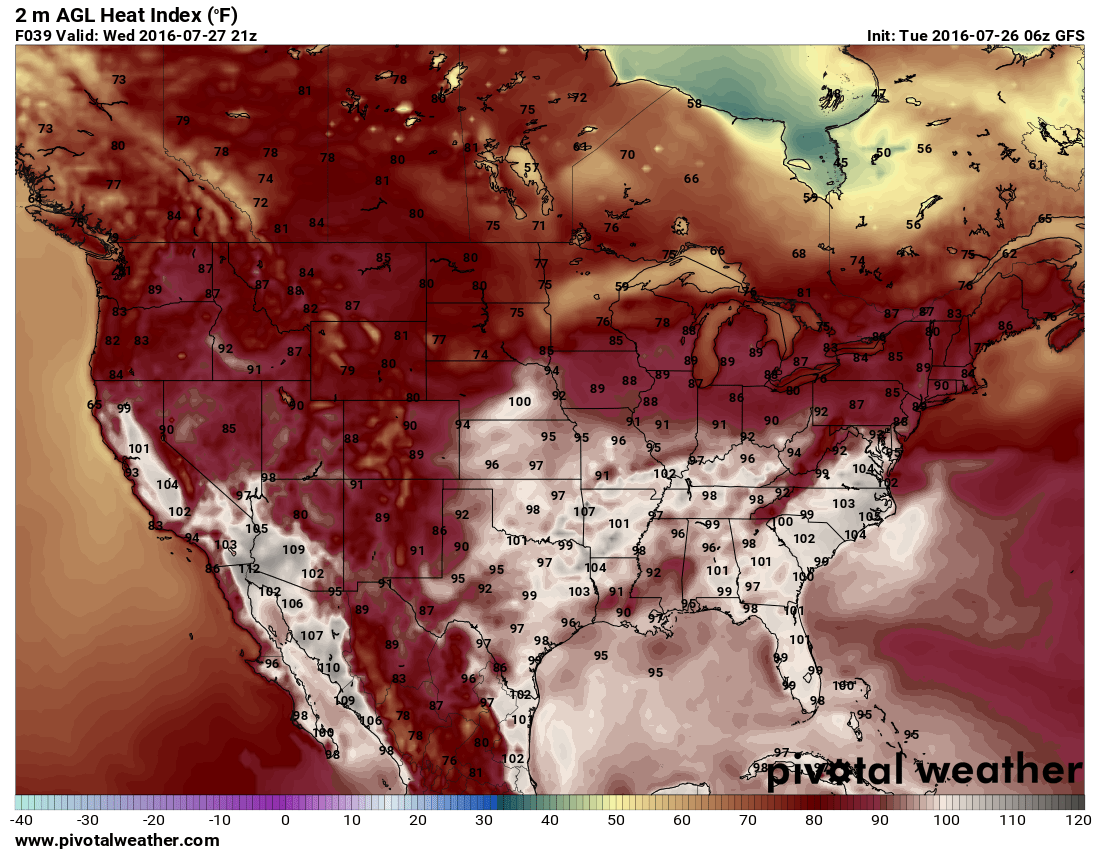
GFS: Projected heat index for Wednesday 3pm
Heat Index or "Apparent Temperature"
Unfortunately for our friends to the East, this pattern does not look to let up in the near future. It looks like late in the weekend into next week before we finally see some relief.
The image to the left shows the projected heat index for around 3PM mountain time on Wednesday. The heat index is basically calculated by the temperature and relative humidity. Using an equation with these two values you can arrive at a heat index (also called an apparent temperature.) This is what the temperature actually feels like to you when you are outside.
In Colorado, due to our lower humidity we generally don't have a problem with high heat indices, in fact we often see heat indices lower than the actual temperature. A 100 degree day in Denver may actually only feel like 96, due to our lower heat index.
A Look at the Past 7 Days
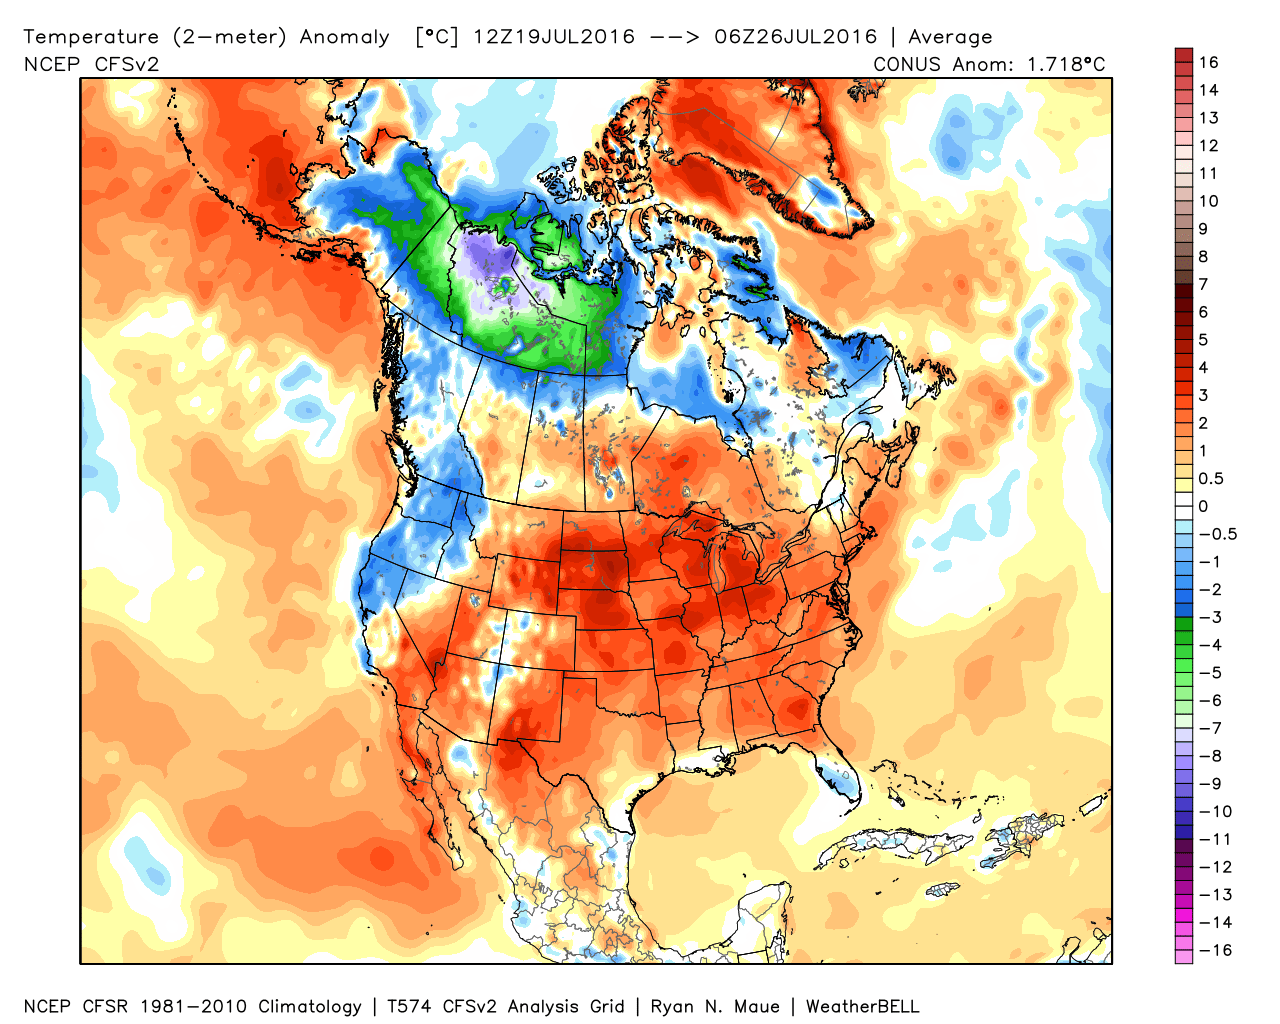
2M Temperature Anomalies from last 7 days (Courtesy: Weatherbell)
No need to dwell on this too much but the 2m temperature anomaly for the last 7 days shows a lot of red! This graphic depicts red and orange in areas where temperatures have been above average and blues and greens where below average. If you look at a map like this for the entire year you see a lot of reds and oranges, no doubt that 2016 is on track to be the warmest year on record.
When Will We Get A Break From The Heat?
The ridge has held strong across the Central U.S. for a few weeks now and when I look at some of the long term models not many show the feature breaking down in the near future. Some forecasts show a glimmer of hope for the middle of next week time-frame but I don't see a lot of model support for it.
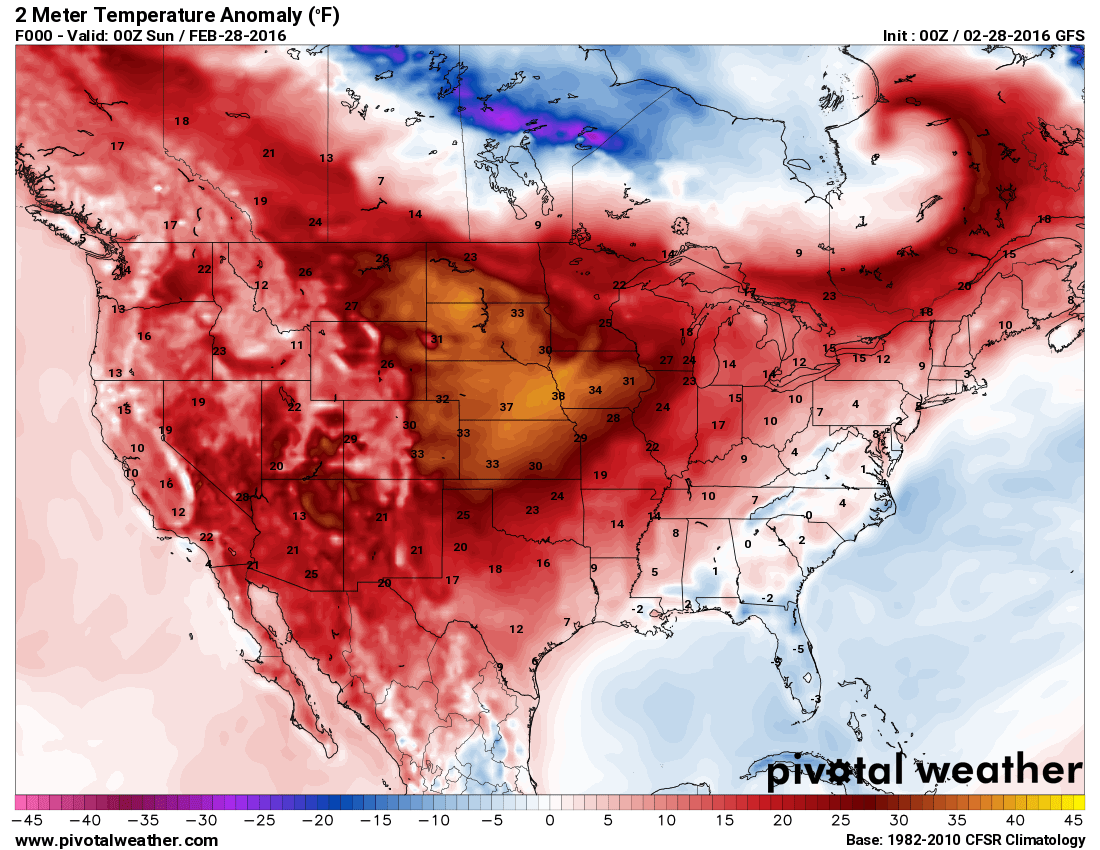
For example; some forecasts call for temperatures for the middle of next week to be in the low 80's, but the long range GFS shows the ridge still holding strong and temps well into the 90's. Notice that big blob of hot air across the Western U.S. doesn't move from the images I had posted earlier in the article (from this week)

Tuesday 8/2/2016 projected temps from GFS
All in all, don't expect a major cool-down anytime this week and given the low confidence on forecasts vs. model guidance for next week, I'd put the chance of a cool-down or major pattern shift at 50%. I'll continue to keep an eye out for signs of a shift as we move into this weekend.
For the rest of this week expect hot conditions to continue. The monsoon will make an appearance here and there based on how the ridge wobbles and how our winds shift, some days will feature rain and some will be dry. The general trend looks that the later we get into the week the more spotty thunderstorms will be.
Happy Tuesday!
